Understanding Africa’s key challenges: Nutrition, Health and Human Capital
by Massimo Livi Bacci
Current trends show that Sub-Saharan Africa is trapped in a Malthusian vicious circle, where poverty nourishes hunger, malnutrition and high infant mortality which, coupled with high fertility, imply a high rate of growth that generates more poverty. Sub-Saharan Africa’s food and demographic issues need to be tackled together, to break the circle.
FOOD → NUTRITION → DISEASES → SURVIVAL → REPRODUCTION → DEMOGRAPHIC GROWTH → FOOD
The key role of food and nutrition
Considering our outline of the main characteristics of the demographic scenarios and of the main trends in climate change within the five major regions of our interest, it is clear that in the absence of appropriate policies, an unchecked rate of population increase will imply a three-fold increase of the population before mid-century.
This will plunge this populous area into the negative spiral of a Malthusian trap:
In this environment, children are particularly vulnerable; insufficient nutrition impedes the proper development of physical and cognitive capacities, has a negative effect on the learning capacities of the child, and ultimately impedes the formation of human capital, with negative consequences extending across individuals’ entire lifespan. Inadequate nutrition, therefore, may produce another negative pattern that intersects with the one outlined above:
INADEQUATE NUTRITION → RETARDATION OF PHYSICAL GROWTH → LACK OF ACCESS TO ADEQUATE EDUCATION → DIMINISHED PRODUCTIVITY → DIMINISHED EARNINGS AND INCOME
At the aggregate level – with all other factors held constant (education, investment in health, etc) - insufficient nutrition negatively affects productivity and economic development. Among the Sustainable Development Goals for the 2030 Agenda, Goal 2, “End Hunger”, envisages the “end of all forms of hunger and malnutrition by 2030, making sure that all people – especially children – have access to sufficient and nutritious food all year round”. This goal will be extremely difficult to achieve for Sub-Saharan Africa (SSA), where currently one out of four people goes hungry. The burden of disease is still extremely high, infant and child mortality (95 per thousand in 2010-15) is more than triple that of Western Asia and two and half times that of Northern Africa; the incidence of transmissible diseases also remains very high. A rapid improvement of nutritional patterns is, therefore, a priority in order to achieve satisfactory levels of health and survival, cornerstones of human capital and fundamental drivers of development. Coping with this challenge also requires investments and social policies to provide proper water sanitation and infectious disease control.

Measuring nutrition to assess human capital
According to 2017 estimates by intergovernmental organizations, global hunger now affects 815 million people (FAO, IFAD, UNICEF, WFP and WHO 2017). The last quarter of a century has brought an improvement in the nutritional conditions of developing countries, albeit with many exceptions. According to FAO estimates, in 1990-92, the prevalence of undernourishment (or in current parlance, people suffering hunger) in developing countries’ populations was 23,3%; this proportion has been (almost) halved to 12.9% in 2014-16 1. One of the Millennium Goals, perhaps the most significant one, has been achieved. However, in SSA progress has been much less impressive, and the same proportion, over the same time span, has fallen from 33% to 23.3%. Moreover, because of the very rapid growth of the population, the total number of hungry people has increased by more than one fifth, from 176 to 218 million. In other words, the efforts (in terms of human and monetary resources) needed to reduce hunger in this part of the world need to be much stronger than a quarter of a century ago.
DES (Dietary Energy Supply) reports the values of the index for the different Sub-Saharan regions, and for a comparison, Northern Africa and Western Asia. The index measures the average calories available to each individual (of every age and gender) per day. Over the 1991-2015 period, the gap between Northern Africa, where the nutritional situation is relatively adequate, and SSA where malnutrition is rampant, has widened.

In 2014-16, DES in North-Africa was 43% higher than in the rest of the continent, and 68% higher than in Middle Africa, where DES has actually declined. The FAO has designed another measure called ADESA (Average Dietary Energy Supply Adequacy) consisting of the ratio between the average caloric supply and the population’s actual needs.
This measure provides a better insight into the nutritional situation of a country or a region. An index of around 100 would mean that food provision would be sufficient only in the case of perfect equality of access to food among its citizens. However, 100 is never enough, because this we need to take account of inequality. Therefore, an index of 100 would imply a very high proportion of people suffering hunger. Even countries with indexes of up to 115 are hit hard by the scourge of malnutrition. Over the period considered, the index has increased, in SSA, from 100 to 111, a small progress given the low starting point that compares with an increase of the same index, for the entire developing world, from 108 to 120. It is worth noting the decline for Middle Africa (from 101 to 95) and the robust progress of Western Africa (from 107 to 125) which has almost reached the level of Southern Africa, the richest region of SSA.
Two other indicators (see Prevalence of undernourishment below and Depth of food deficit next page) can provide a better insight into the nutritional status of the population. The first one reports the prevalence of undernourishment (defined by FAO as an estimate of the percentage of people in a population who are unable to get enough food to cover normal energy requirements; see also FAO 2017).
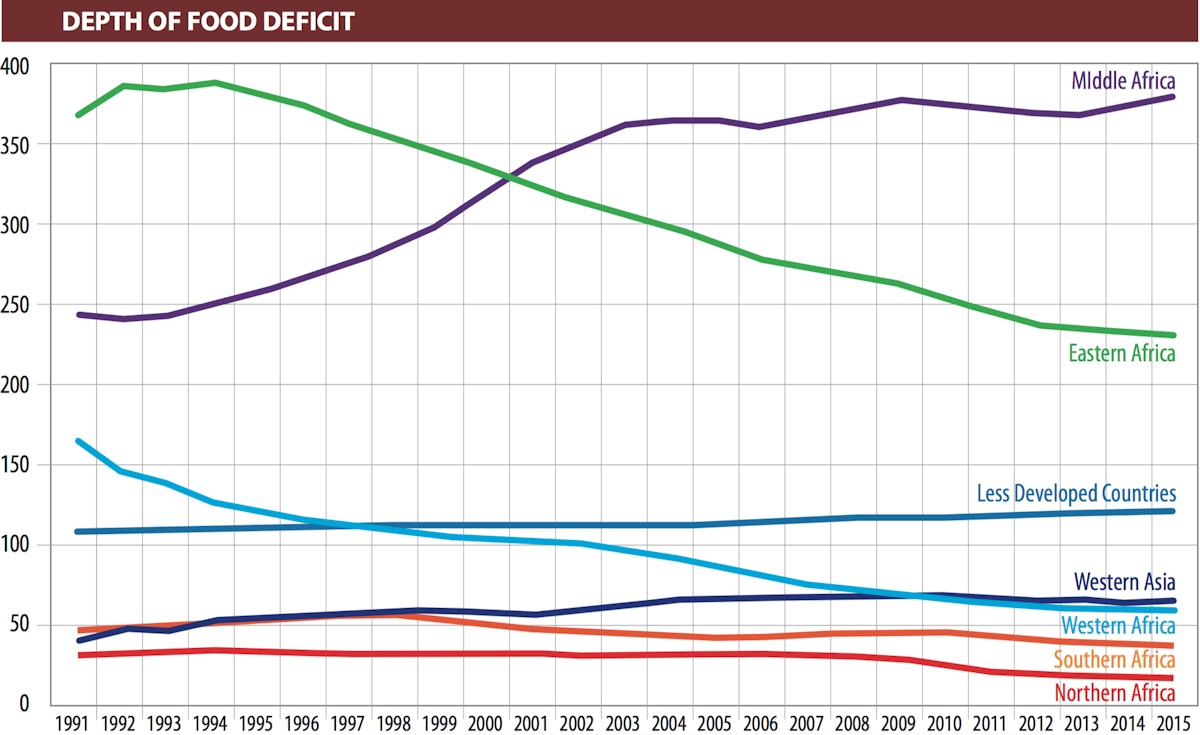
In the entire SSA region, almost one out of four individuals goes hungry, but while in Western and Southern Africa the incidence is below 10%, in Eastern Africa is above 30% and in Middle Africa above 40%. The “Depth of Food Deficit” (DPD) indicator measures the average number of calories needed in order to lift a deprived and undernourished individual above the hunger threshold and show us the scope of hunger.

Trends and differentials of the five Sub-Saharan regions depict a situation similar to that revealed by the other indicators; the average individual would need a daily supplement of 175 calories for SSA, 230 in Eastern Africa, and 380 in Middle Africa. It should be noted that despite counting over two hundred million hungry people, most inhabitants of SSA are not dying of starvation. However, the presence of chronic hunger is not always apparent because the body compensates for an inadequate diet by slowing down physical activity and, in the case of children, growth.
The geography of undernutrition
The causes of undernutrition are diverse but in most cases include limited quality or quantity of food, suboptimal feeding practices and high rates of infectious diseases. Acute undernutrition (wasting) occurs as a consequence of short-term response to inadequate intake or to an infectious disease episode, and can be reversed if the child has access to adequate dietary intake in an environment which is free from infectious diseases. Stunting results from insufficient intake of food over a long period of time and may be worsened by recurrent infections. Wasting is a short-term health issue, but recurrent episodes of it may lead to stunting (Saka, Galaa 2016). “Reducing the prevalence of stunting among children, particularly 0-23 months, is important because linear growth deficit accrued early in life is associated with cognitive impairments, poor educational performance and decreased productivity among adults. Better nutrition leads to increased cognitive and physical abilities, thus improving individual productivity in general, including improved agricultural productivity”. 2
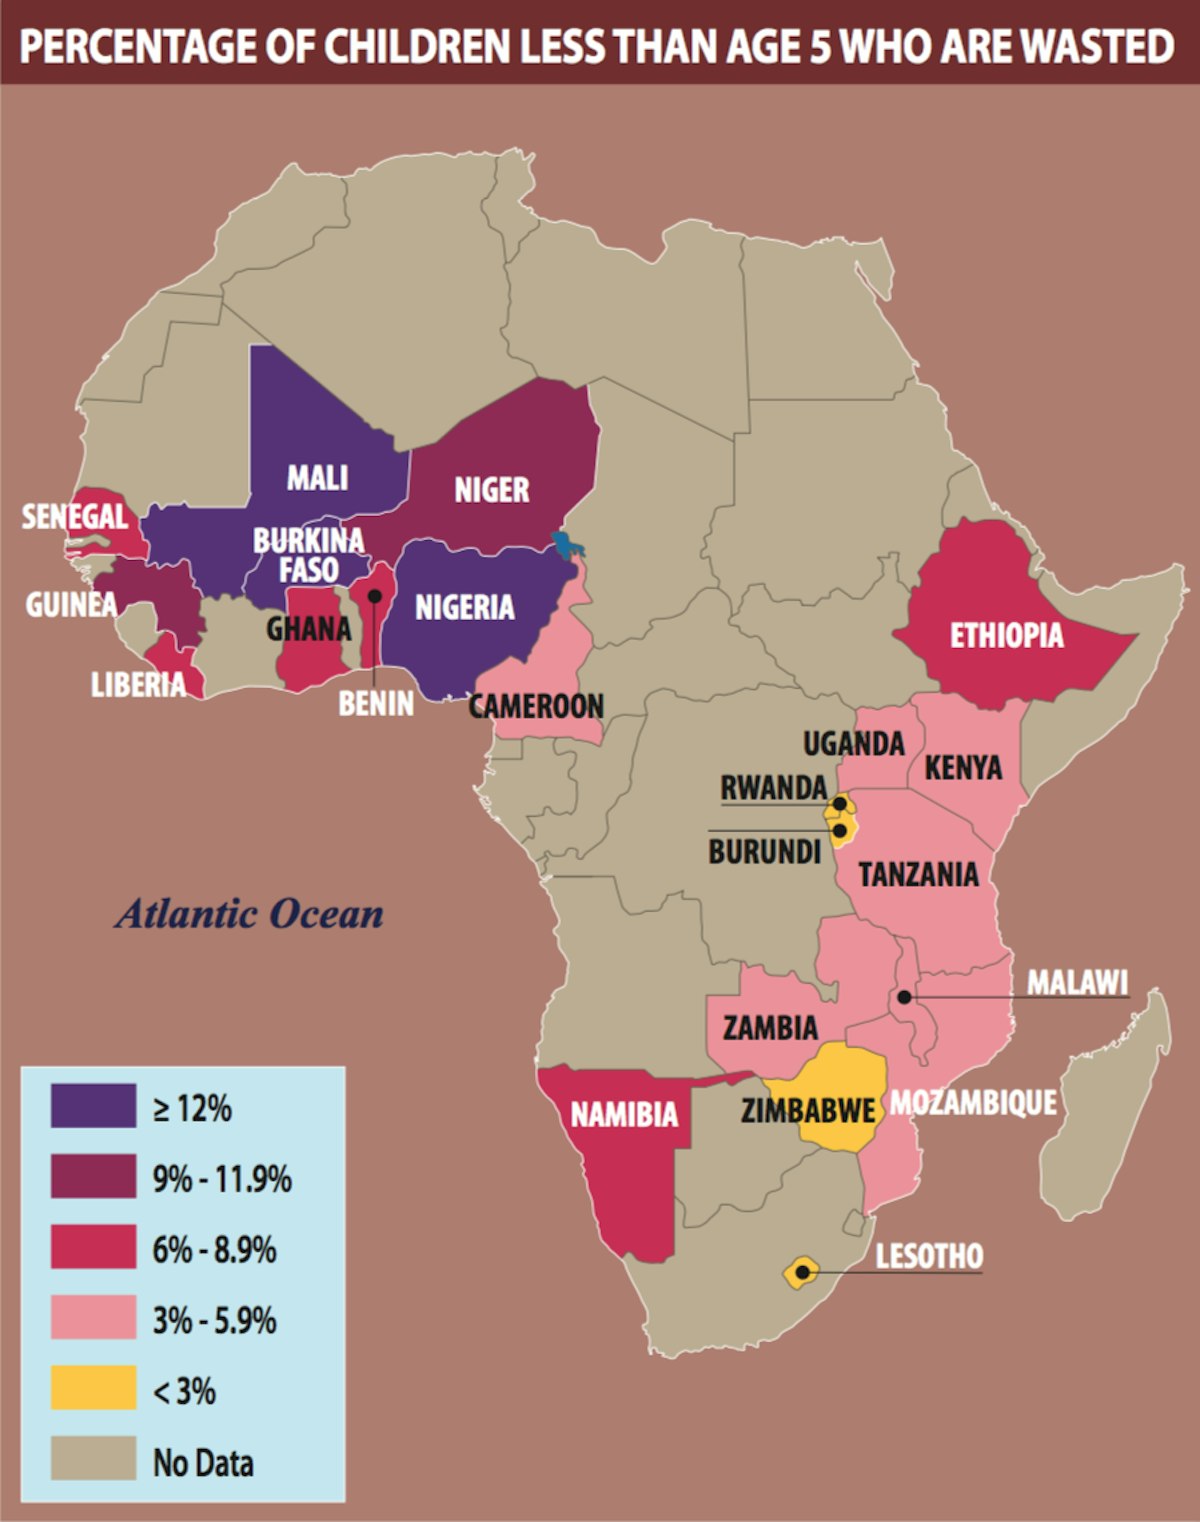
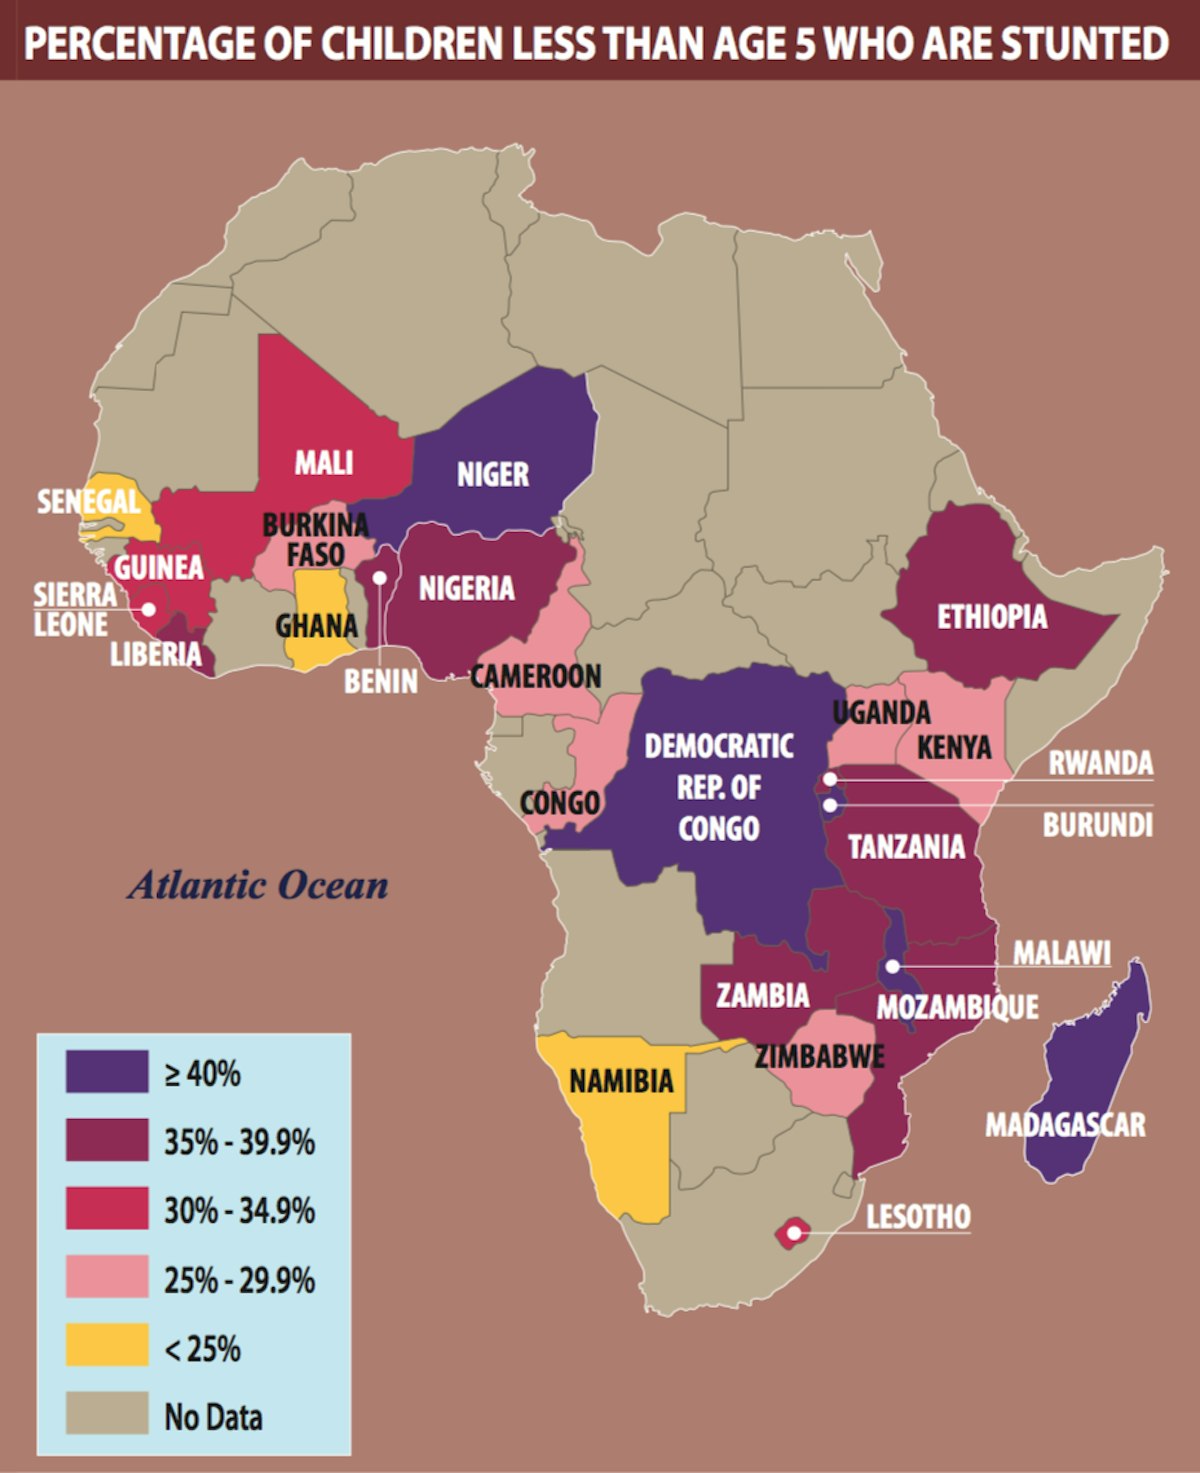
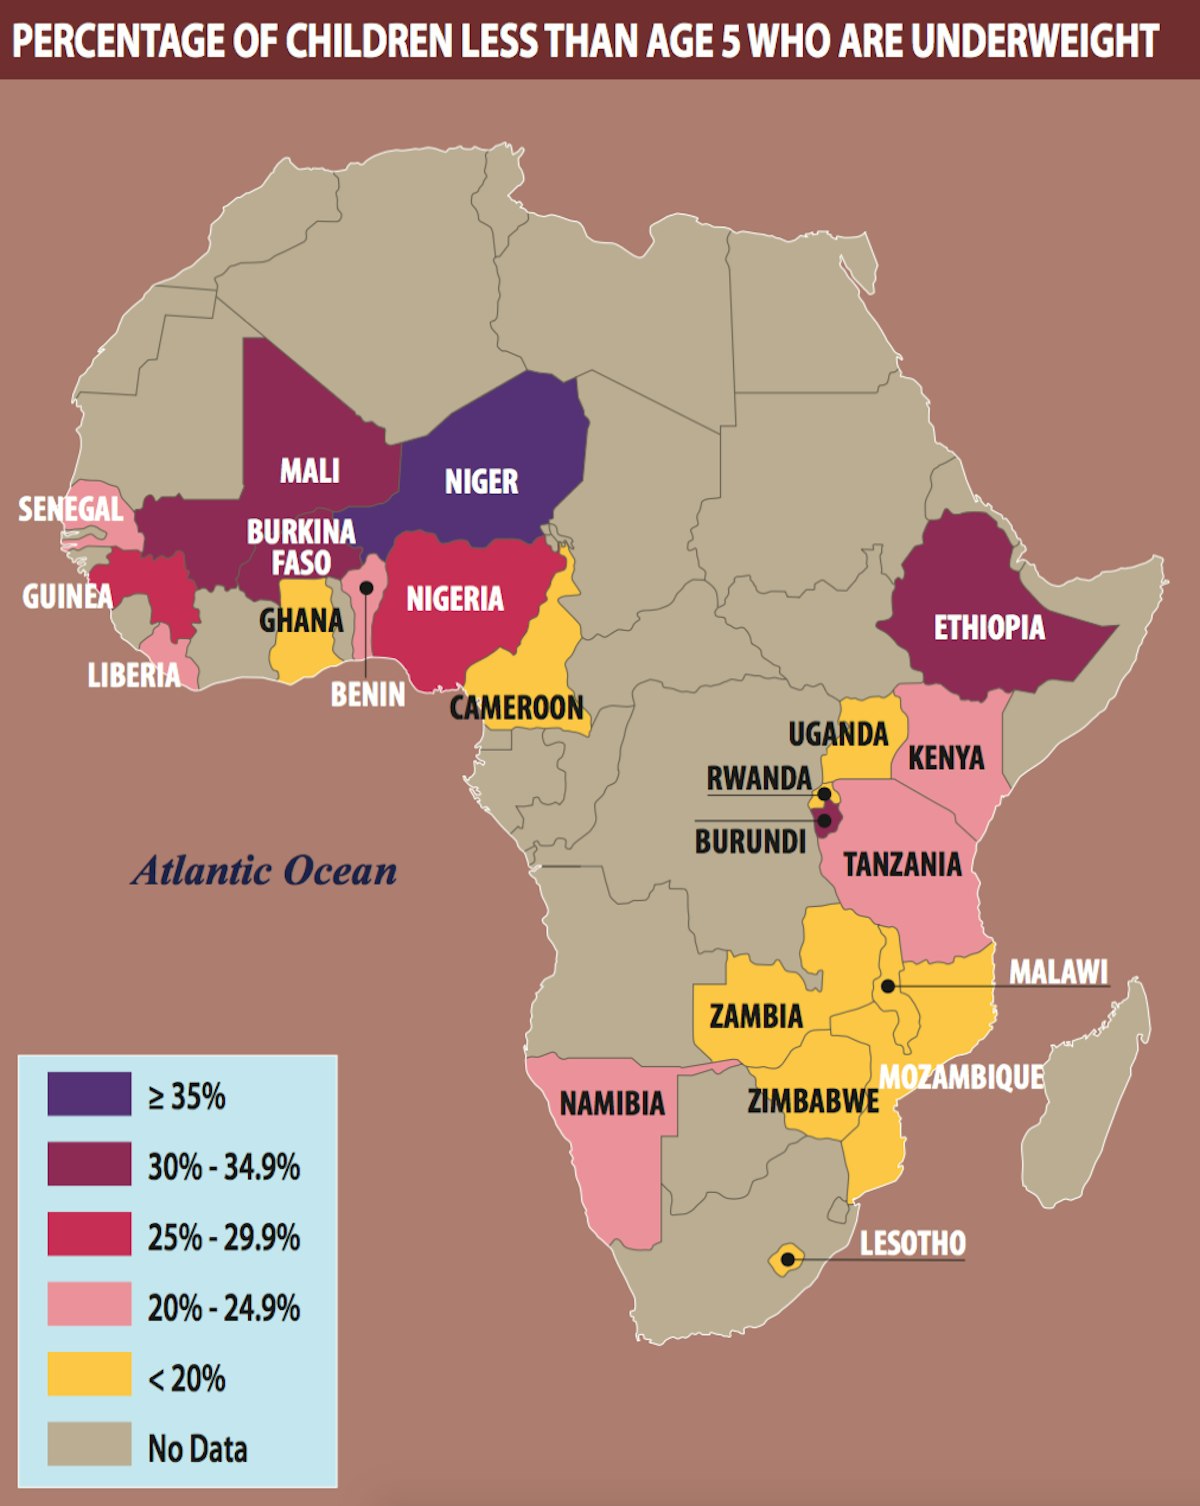
The Demographic and Health Surveys (DHS) are an important source of information on nutrition in many developing countries, particularly in Africa. Over the last three decades, the DHS program has collected and analysed accurate and representative data on demography, health status, HIV and nutrition in 90 countries in over 300 surveys. The table and maps3 present the estimates of the percentage of children under 5 years of age who were wasted, stunted and underweight in 14 countries of Africa according to the most recent survey (taken between 2010 and 2014), as well as in the preceding survey (taken between 2002 and 2009) 4.
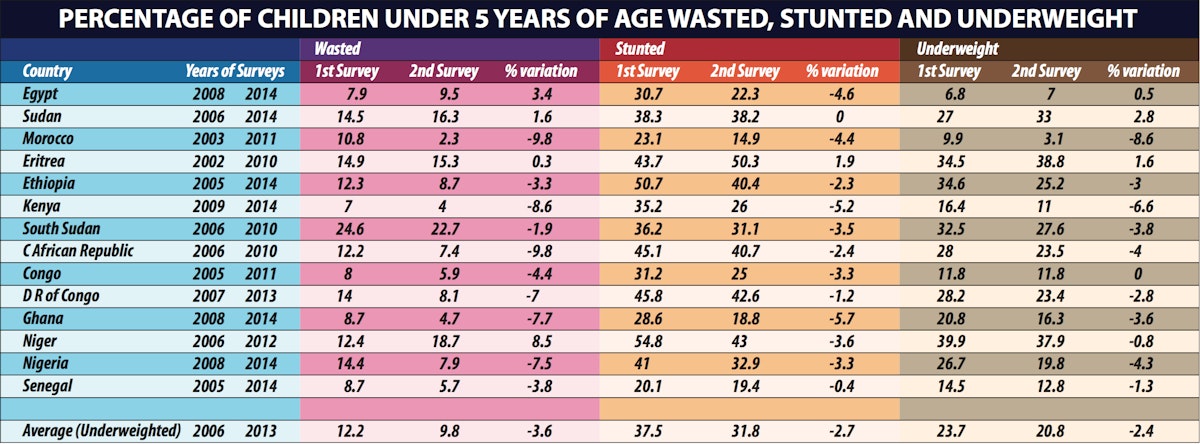
The prevalence of stunting has decreased globally, but in Africa progress (if any) has been slow, in spite of the relatively robust economic growth since the beginning of this century. Stunting has almost disappeared in developed countries and in many developing ones, but the un-weighted average for the 14 countries was 37.5% in the first of the two surveys considered and 31.8% in the second one, taken on average 6-7 years later. In Eritrea, 1 out of 2 children under five are stunted, in Ethiopia, Sudan, Central African Republic, D.R. of Congo, 4 out of 10; in South Sudan and Nigeria 1 out of 3. At the current rate, two or three decades would be needed in order to reduce stunting from a mass phenomenon to a marginal one. Similar considerations can be made on the basis of the other two indicators: as for wasting, prevalence has increased from the first to the second survey in 4 out of the 14 countries; the prevalence of children underweight has increased in two cases and in one has remained unchanged.
BOX: FOCUS ON NIGERIA
A further insight into the nutritional status in Sub-Saharan populations can be gained from the DHS Survey of Nigeria, its most populous state, carried out on a large sample of 40,000 households in 2013 (NPC and ICF International 2014). Anthropometric measures indicating stunting (height-for-age), wasting (weight-for-height) and underweight (weight-for-age) have been taken for children, according to sex, characteristics of birth (size, birth interval), feeding practices (lactation, supplementary food), background characteristics of the household (geographical residence, urban and rural residence, wealth of the household) and of the mother (education, nutritional status). The survey has also measured the micronutrients intakes of children and mothers. It is important to underline the fact that child and infant mortality (zero to five years of age) in Nigeria in 2010-15 was higher than in SSA (122 against 95 per thousand), despite a per capita income that is higher than the regional average.
A synthesis of the results is reported in the table of the previous page. Stunting (height for age), including also “severe stunting”, increases until the age of 24-35 months – reaching 46% of children (of which 27% are severely stunted) – with a slight decline after that age (37% at age 48-59 months). The proportion of children which does not receive, after the age of 6 months, the necessary complementary foods beside being breastfed is too high; only 10% of children aged 6 to 24 months are fed appropriately based on recommended infant and young child feeding practices. Lack of appropriate complementary feeding may lead to undernutrition and frequent illness. Stunting is higher in male children (39%) than in female children (35%). “Stunting is higher among children with a preceding birth interval of less than 24 months (41%) than among children who were first births and children with a preceding birth interval of 24-47 months or 48 months or more”. In other words, high fertility (women with short intervals between successive births) is associated with high frequency of stunting among their children. In Nigeria, as elsewhere in SSA, there is a high frequency (47.6%) of mothers who are underweight (with a BMI, Body Mass Index, below 18.5) and a high frequency of mothers who are “overweight or obese” (BMI above 25). Moreover, mothers’ nutritional status has an impact on the level of stunting in their children: children whose mothers are underweight have the highest levels of stunting (48%), while those whose mothers are overweight or obese have the lowest levels (25%). “Children in rural areas are more likely to be stunted (43%) than those in urban areas (26%), and the pattern is similar for severe stunting (26% in rural areas and 13% in urban areas)”. The level of education of mothers shows an inverse association with stunting in their children, ranging from a low of 13% among children whose mothers have higher educational attainment to 50% among those whose mothers have no education at all. “A similar inverse relationship is observed between household wealth and stunting. Children in the poorest households are three times as likely to be stunted (54%) as children in the wealthiest households (18%)” 5. The survey also revealed that a significant proportion of children suffered micronutrient deficiencies (vitamin A and iron) in their diets, an important factor in child morbidity and mortality.

Breaking the vicious circle: the 175 calories goal
Both macro and micro data reported in this section show that nutrition continues to be a major problem in SSA. Progress in the last decades has been slow and in some countries absent; the proportion of the population that suffers hunger has declined slowly, and the number of hungry people has increased because of the unchecked growth of the population. In order to lift these over 200 million people from their status of deprivation, 175 calories per/day and per/capita would be needed. Undernutrition, stunting and wasting are rampant among children, and the high fertility rate exacerbates the situation. Among mothers, obesity coexists with excessive thinness.
It is key to emphasize that Sub Saharan Africa has an unresolved food problem and an unresolved demographic problem. Undernutrition with its negative consequences on health, physical growth, and cognitive abilities, undermines the formation of human capital, slows individual productivity and makes balanced development more difficult to achieve.
NOTES
1 These data, as well those at the base of Figures 1, 2, 3 and 4, are taken from FAO Food Security Indicators http://www.fao.org/economic/ess/ess-fs/ess-fadata/en/#.Wg3LGRP9TL8
3 Kamanori, Pullum 2013.
4 These are anthropometric measures: stunting is height-for age; wasting is weight for height, underweight is weight-for-age.
5 This and the two previous quotes are taken from NPC and IFC International 2014, p. 177.


